Shadow Detail Comparison
(Go back to All About RGB Working Spaces page)
(Revised March 7, 2017)
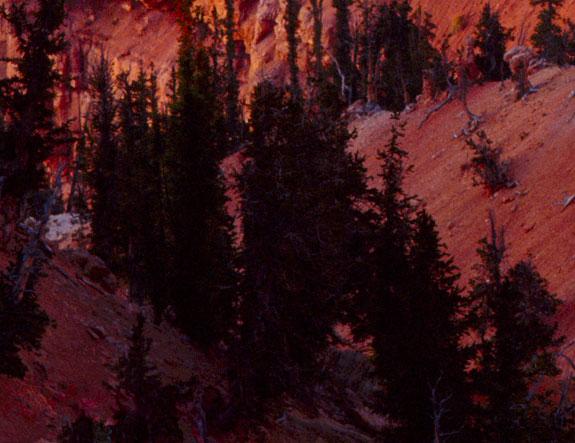
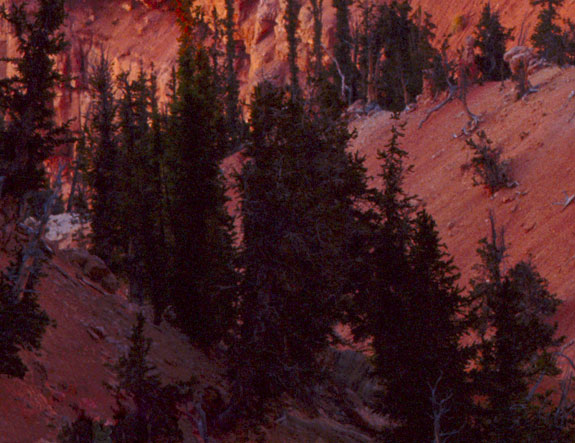
This first image was converted from a very small section of a master file of a transparency of mine into Ekta Space PS 5, maintaining the appearance of the image. I scaled it to 50% then saved it. I then assigned Chrome Space 100 to it, changing the appearance as shown in the lower image, and saved it again. Finally I converted each to sRGB and saved them as web JPEGs in the exact same manner, retaining the appearance of the earlier results.
The point of this comparison is to illustrate the differences between the generic, gamma 2.2 tone curve of Ekta Space PS 5 and the proprietary, perceptually uniform tone curve in my other profiles. This difference is particularly useful to people who have scans of transparencies in Ekta Space because they can assign Chrome Space 100 and achieve this particular change, which is likely to be desirable. The tone curve is the only difference between the two profiles.
It may have occurred to you that you could scan into Ekta Space and then assign Chrome Space 100 whenever you wanted such a boost in shadow detail, and indeed this may be a useful technique though I have never done it myself. It would be most likely to be useful in an RGB scanning software environment (not in an LCH scanning enviroment, such as LinoColor or NewColor from Heidelberg, in which I work, and in which I use related, special techniques to achieve this kind of control over both shadows and highlights).
This bit of image has been neither degrained nor sharpened. It's from the lower left corner of "Alpenglow, Cedar Breaks National Monument, Utah 1991" in my Gallery.